监控工具
使用 perf 调优性能
安装perf
Linux 中最常用的性能调优工具 Perf(Linux 系统原生提供的性能分析工具), 在terminal输入如下命令,安装与当前内核版本一致的工具:
sudo apt-get install linux-tools-common linux-tools-generic
sudo apt-get install linux-tools-"$(uname -r)"
sudo apt-get install linux-cloud-tools-"$(uname -r)"
sudo apt-get install linux-cloud-tools-generic
一般环境中,安装完成后,使用perf top/perf record需sudo权限加持:
perf_event_open(..., PERF_FLAG_FD_CLOEXEC) failed with unexpected error 13 (Permission denied)
perf_event_open(..., 0) failed unexpectedly with error 13 (Permission denied)
Error:
You may not have permission to collect stats.

Consider tweaking /proc/sys/kernel/perf_event_paranoid,
which controls use of the performance events system by
unprivileged users (without CAP_SYS_ADMIN).

The current value is 3:

  -1: Allow use of (almost) all events by all users
      Ignore mlock limit after perf_event_mlock_kb without CAP_IPC_LOCK
>= 0: Disallow ftrace function tracepoint by users without CAP_SYS_ADMIN
      Disallow raw tracepoint access by users without CAP_SYS_ADMIN
>= 1: Disallow CPU event access by users without CAP_SYS_ADMIN
>= 2: Disallow kernel profiling by users without CAP_SYS_ADMIN

To make this setting permanent, edit /etc/sysctl.conf too, e.g.:

        kernel.perf_event_paranoid = -1
两种解决方法:
-
使用sudo权限,如
sudo perf top -
设置
kenel.perf_event_paranoid
2.1 临时设置,需要sudo su切换到root用户后再进行如下操作,操作完成后返回原用户,此时输入perf top可以正常工作。该方法系统重启后失效。 如果是ubuntu16.04系统:
echo 0 > /proc/sys/kernel/kptr_restrict
echo -1 > /proc/sys/kernel/perf_event_paranoid
如果是ubuntu18.04系统(未实测):
echo -1 > /proc/sys/kernel/perf_event_paranoid
另一种方法是:
sudo sysctl -w kernel.perf_event_paranoid=1
2.2 修改配置文件,重启后仍有效。
编辑/etc/sysctl.conf,在文件末尾加上:
kernel.kptr_restrict=0  #如果是ubuntu16.04
kernel.perf_event_paranoid= -1
最后,使用sysctl -p /etc/sysctl.conf命令更新配置文件。
测试程序
使用 perf 先对应用(假设要采样的应用为 JavaApp)进行采样,使用 record 命令,如下:
perf record java JavaApp
另外 perf 能按出现的百分比降序打印 CPU 正在执行的函数名以及调用栈,如命令:
perf report -n
火焰图
Linux 性能优化大师 Brendan Gregg 发明了火焰图
(因整个图形看起来像燃烧的火焰而得名),以全局的方式来看各个函数的调用时间分布,
以图形化的方式列出调用栈。 关于 perf 和火焰图使用方法可以参官网
http://www.brendangregg.com/FlameGraphs/cpuflamegraphs.html
火焰图 X 轴表示被抽样到的次数。理解 X 轴的含义,需先了解采样数据的原理。 Perf 是在指定时间段内,每隔一段时间采集一次数据,被采集到的次数越多, 说明该函数的执行总时间长,可能的原因有:调用次数多,或者单次执行时间长。
因此,X 轴的宽度不能简单的认为是运行时长。Y 轴表示调用栈。
如何从火焰图看出性能的瓶颈在哪里?最有理由怀疑的地方,顶层的“平顶”。
火焰图定位问题的实战例子:
问题发生的场景是客户端向服务器发起 http 请求,服务器返回数据给客户端 (这是一个非常简单的服务交互)。
统计了 20 次服务器的响应时长, 发现使用 JDK 8u74 的性能要远优于 JDK 8u202 的性能。
从响应时间来看,8u202 相比 8u74 性能下降 13 倍之多,由于应用本身并未做任何修改,所以考虑使用火焰图来定位性能消耗的问题点。在 8u74 和 8u202 分别运行应用,并用 perf 的 record 抓取数据并生成火焰图。 火焰图定位
对比两张火焰图,使用 8u74 时ClientHandshaker.processMessage占比为 1.15%,
而在 8u202 中这个函数占比为 23.98%,
很明显在ClientHandshaker.processMessage带来了性能差异:
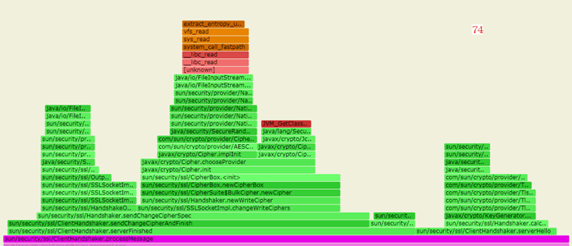
两者在这个ClientHandshaker.processMessage上的 cpu 消耗差异很大,继续分析这个函数找到根因。
void processMessage(byte handshakeType, int length) throws IOException {
    if(this.state >= handshakeType && handshakeType != 0) {
        //... 异常
    } else {
        label105:
        switch(handshakeType) {
        case 0://hello_request
            this.serverHelloRequest(new HelloRequest(this.input));
            break;
        //...
        case 2://sever_hello
            this.serverHello(new ServerHello(this.input, length));
            break;
        case 11:///certificate
            this.serverCertificate(new CertificateMsg(this.input));
            this.serverKey = this.session.getPeerCertificates()[0].getPublicKey();
            break;
        case 12://server_key_exchange 该消息并不是必须的,取决于协商出的key交换算法
            //...
        case 13: //certificate_request 客户端双向验证时需要
            //...
        case 14://server_hello_done
            this.serverHelloDone(new ServerHelloDone(this.input));
            break;
        case 20://finished
            this.serverFinished(new Finished(this.protocolVersion, this.input, this.cipherSuite));
        }
        if(this.state < handshakeType) {//握手状态
            this.state = handshakeType;
        }
    }
}
processMessage()主要是通过不同的信息类型进行不同的握手消息的处理。
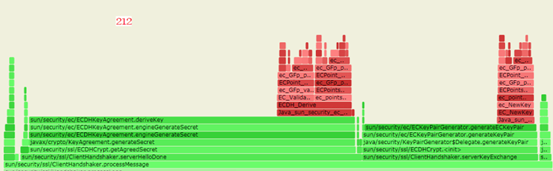
而在火焰图中可以看到,JDK8u74 图中,
主要消耗在函数serverFinished()和serverHello()上,而 JDK8u202 主要消耗在函数
serverHelloDone()和serverKeyExchange()。
在介绍火焰图的时候,我们有提到,X 轴的长度是映射了被采样到的次数。
因此需要进一步确定消耗:函数单次执行耗时过长而成为热点,
还是因为频繁调用函数导致函数耗时过长而成为热点。
可通过字节码插桩(通过Instrument技术实现对函数的计数,然后编译成agent,
执行应用时加载 agent,具体使用Instrument的方法可以参考官方文档)查看函数
serverHelloDone()的调用次数及执行时间。
JDK8u202 数据
Execute count : 253
Execute count : 258
Execute count : 649
Execute count : 661
serverHelloDone execute time [1881195 ns]
Execute count : 1223
Execute count : 1234
Execute count : 1843
Execute count : 1852
serverHelloDone execute time [1665012 ns]
Execute count : 2446
Execute count : 2456
serverHelloDone execute time [1686206 ns]

JDK8u74 数据
Execute count : 56
Execute count : 56
Execute count : 56
Execute count : 56
Execute count : 56
Execute count : 56
Execute time 是取了每 1000 次调用的平均值,Execute count 每 5000ms 输出一次总执行次数。很明显使用 JDK8u202 时在不断调用 serverHelloDone,而 74 在调用 56 次后没有再调用过这个函数。
初始化握手时,serverHelloDone 方法中,客户端会根据服务端返回加密套件决定加密方式,构造不同的 Client Key Exchange 消息;服务器如果允许重用该会话,则通过在 Server Hello 消息中设置相同的会话 ID 来应答。这样,客户端和服务器就可以利用原有会话的密钥和加密套件,不必重新协商,也就不再走 serverHelloDone 方法。从现象来看, JDK8u202 没有复用会话,而是建立的新的会话。
查看 JDK8u 161 的 release notes,添加了 TLS 会话散列和扩展主密钥扩展支持,找到引入的一个还未修复的 issue,对于带有身份验证的 TLS 的客户端,支持 UseExtendedMasterSecret 会破坏 TLS-Session 的恢复,导致不使用现有的 TLS-Session,而执行新的 Handshake。
JDK8u161 之后的版本(含 JDK8u161),若复用会话时不能成功恢复 Session,而是创建新的会话,会造成较大性能消耗,且积压的大量的不可复用的 session 造成 GC 压力变大;如果业务场景存在不变更证书密钥,需要复用会话,且对性能有要求,可通过添加参数-Djdk.tls.useExtendedMasterSecret=false来解决这个问题。
JDK 从8升级到11,使用 G1 GC,HBase 性能下降近20%。JDK 到底干了什么?
https://my.oschina.net/openeuler/blog/5163446